Three Dimensional Plots
Three-dimensional plots basically display a surface defined by a function in two variables, g = f (x,y).
As before, to define g, we first create a set of (x,y) points over the domain of the function using the meshgrid command. Next, we assign the function itself. Finally, we use the surf command to create a surface plot.
The following example demonstrates the concept −
Example
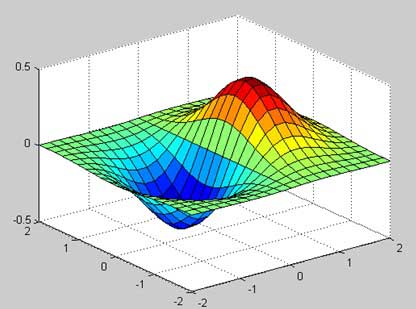
Let us create a 3D surface map for the function g = xe-(x2 + y2)
Create a script file and type the following code −
[x,y] = meshgrid(-2:.2:2);
g = x .* exp(-x.^2 - y.^2);
surf(x, y, g)
print -deps graph.eps
When you run the file, MATLAB displays the following 3-D map −
You can also use the mesh command to generate a three-dimensional surface. However, the surf command displays both the connecting lines and the faces of the surface in color, whereas, the mesh command creates a wireframe surface with colored lines connecting the defining points.